Published 10/1/2019
|
John Cherf, MD, MPH, MBA
Editor’s note: This article is the third of a four-part series that discusses results from the 2018 AAOS Census Survey and examines orthopaedic surgeon practice setting and productivity in the United States. The first two installments appeared in the August and September issues of AAOS Now. The final article will appear in the November issue and will assess financial data.
Since 1985, there have been 17 Orthopaedic Practice in the United States (OPUS) surveys. OPUS, also known as the AAOS Census Survey, gathers demographic and practice data of U.S.-based orthopaedic surgeons who are members of AAOS. In 2018, about one in four AAOS members (23.3 percent) responded to the survey, a lower response rate than in past years (Fig. 1).
The data are analyzed by the AAOS research, quality, and scientific affairs department, and the information helps ensure that AAOS members are accurately represented, that Academy programs and products evolve to reflect changes in membership, and that AAOS continues to address the professional needs and interests of its members.
This article addresses information on practice setting, productivity, payer mix, payer distribution, work hours, and procedures performed per month.
Full- versus part-time
According to the 2018 OPUS, full-time surgeons are, on average, 50.2 years old; the average age of part-time surgeons is 69.7 years. Full-time surgeons work an average of 52.7 hours per week and perform 32.1 procedures per month, whereas part-time surgeons work an average of 22.7 hours per week and perform 7.3 procedures per month. Part-time orthopaedic surgical productivity rose slightly from the 2014 report but has significantly decreased over the past 10 years (Figs. 2–5).
Full- and part-time surgeons define themselves differently. More than 63 percent of full-time surgeons define themselves as specialists compared to only 29 percent of part-time surgeons. Many part-time surgeons (approximately 46 percent) define themselves as general orthopaedic surgeons.
Most full-time providers work in traditional practice settings such as group private practices. More than 37 percent are in a private practice group, with another 20 percent split nearly evenly between private practice solo (10.7 percent) and private practice multispecialty group (9.0 percent). Approximately 18 percent are hospital-based, whereas just more than 14 percent have an academic practice with a salary from an academic institution.
In contrast, nearly half of part-time orthopaedists are in either a private practice solo (26.3 percent) or a private practice group (22.1 percent). Slightly more than 13 percent of part-time orthopaedists are employed by a hospital, whereas another 13 percent work in another type of setting. Less than 6 percent of part-time orthopaedists have an academic practice with a salary from an academic institution. Practice settings that seem to be more conducive to part-time providers include solo practice, public institution, and locum tenens (Fig. 6).

Fig. 1 Orthopaedic Practice in the United States response rate,
2008–2018
Courtesy of OrthoIndex

Fig. 2 Comparison of full-time and part-time surgeons
2018 OPUS
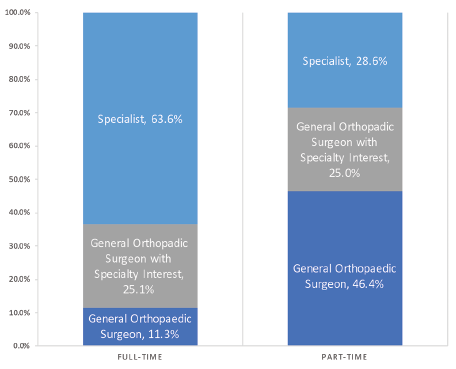
Fig. 3 More than 80 percent of full-time surgeons define themselves as being specialists or having a specialty interest compared to just 60 percent of part-time surgeons.
2018 OPUS
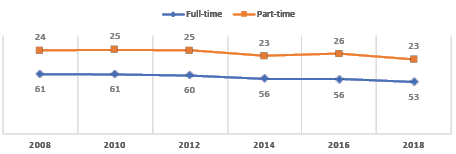
Fig. 4 Average work hours per week for full- and part-time orthopaedists ranging from 2008 to 2016
OPUS 2008, 2010, 2012, 2014, 2016, and 2018

Fig. 5 Although the number of procedures performed per month by full-time orthopaedic surgeons has remained steady, the number of procedures per month by part-time orthopaedic surgeons has significantly dropped.
OPUS 2008, 2010, 2012, 2014, 2016, and 2018

Fig. 6 Settings conducive to part-time orthopaedic practice include solo practices, locum tenens, and public institutions
HMO, Health Maintenance Organization
2018 OPUS

Fig. 7 Practice Setting: 2008, 2010, 2012, 2014, 2016, 2018
2018 OPUS

Fig. 8 Practice setting of orthopaedic surgeons ranging from 2008 to 2018; graph one of two.
2018 OPUS

Fig. 9 Practice setting of orthopaedic surgeons ranging from 2008 to 2018; graph two of two.
2018 OPUS

Fig. 10 Distribution of payor source by work status. Workers compensation patients accounted for nearly a quarter of the patients seen by part-time orthopaedists.
2018 OPUS

Fig. 11 Distribution of payor source by practice setting.
2018 OPUS

Fig. 12 Average work hours by practice setting (full-time orthopaedists)
2018 OPUS

Fig. 13 Average number of procedures per month by practice setting.
2018 OPUS
Practice setting
Members were asked to identify a practice setting from a list of 11 categories. In 2018, more than a third (36 percent) of respondents were in a private practice group setting. The second-largest group was hospital/medical center employment (17 percent), followed by academic practice salaried from an academic institution (14 percent), private practice solo (12 percent), private practice multispecialty (9 percent), and academic practice salaried from a private practice (4 percent). Locum tenens, military, health maintenance organization (HMO), public institution, and “other” each accounted for 1 percent to 3 percent of practice settings (Figs. 7–9, available in the online version of this article).
Payer distribution by work status
Orthopaedic surgeons were asked to approximate distribution of patients by payer source. Although private insurance carriers were the largest payer source (39.6 percent) in the 2018 census, they accounted for just slightly more than Centers for Medicare & Medicaid Services government programs combined (Medicare, 27.3 percent; Medicaid, 11.3 percent) as a source of patients.
The 2018 census marked the highest Medicare and Medicaid combined payer source percentage recorded. This change in payer mix may be secondary to the impact of the Affordable Care Act. Significant differences were found between full- and part-time orthopaedists in patient source distribution by private insurance, workers’ compensation, and charity/pro bono, with part-time providers having a greater percentage of patients from workers’ compensation and charity/pro bono care, whereas full-time orthopaedic surgeons saw more patients from private insurance sources (Fig. 10, available online).
Payer sources by practice setting
According to the 2018 OPUS, orthopaedists in the seven largest practice setting sites listed private insurance and Medicare as their top payer sources. The smaller practice setting site exceptions were military practice, public institution, locum tenens, and “other.” Medicaid was the most common payer source for locum tenens and second highest source of patients for public institutions.
Academic practices (including both salary from an academic institution and private practice) and hospital/medical center employment also saw a disproportionate number of Medicaid patients. The highest workers’ compensation and self-pay payer sources were in private practice solo. Charity/pro bono care was highest for academic practice salary from an academic institution and other practice settings.
Private insurance carriers were the highest payer sources for orthopaedists in private practice (solo, orthopaedic group, multispecialty group), academic practice (salary from an academic institution and private practice), prepaid plan/HMO, hospital/medical center employment, and other. Workers’ compensation, self-pay, and charity/pro bono were not the largest payer source for any practice setting.
Medicare was the second highest payer source for orthopaedists in private practice (solo, orthopaedic group, multispecialty group), academic practice (salary by an academic institution and private practice), and prepaid plan/HMO and hospital/medical center, as well as the highest payer source in the locum tenens practice setting (tied with Medicaid). Significant differences exist in all payer mixes among practice settings (Fig. 11, available online).
Work hours, procedures per month by practice setting
Surgeons in academic settings (both salary from an academic institution and salary from a private practice) work the most hours per week. Surgeons who receive salary from an academic institution work slightly more hours than those who receive a salary from a private practice. Surgeons in the military, private practice orthopaedic groups, hospital/medical centers, private practice multispecialty groups, and private practice solo groups work similar hours. Orthopaedic surgeons in prepaid plan/HMO and public institutions work the least hours per week.
Surgeons in academic practice with salary from a private practice and private orthopaedic groups performed, on average, more than 35 procedures per month, which is higher than any other practice setting category. Private practice multispecialty group, hospital/medical center employment, and academic practice (salary from an academic institution) were the next most productive sites of care for surgical volume—performing, on average, more than 30 cases per month. Surgeons in both military practice and public institutions performed approximately 20 cases per month (Figs. 12 and 13, available online).
The full 2018 OPUS report is available to AAOS members at www.aaos.org/aaoscensus. AAOS members must log in to read the report. It is also available for purchase by AAOS nonmembers.
John Cherf, MD, MPH, MBA, is the practice and payment section leader of the Health Care Systems Committee, a member of the Council on Education, and a member of the AAOS Now Editorial Board.