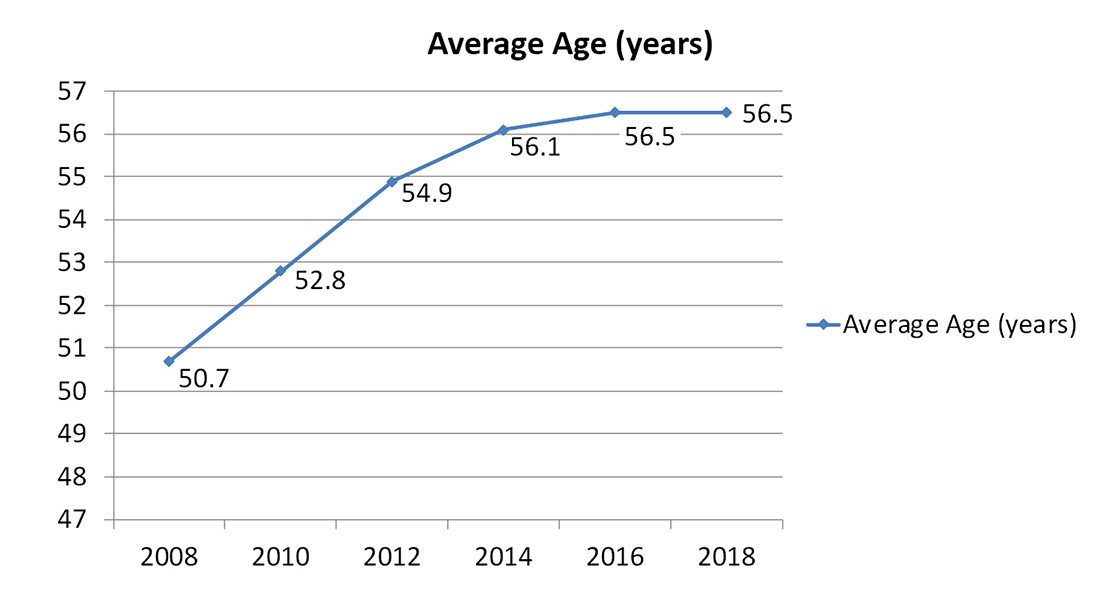
Fig. 1 Average age of orthopaedic surgeons
Published 9/1/2019
|
John Cherf, MD, MPH, MBA
Editor’s note: This article is the second of a four-part series that discusses results from the 2018 AAOS Census Survey. The first installment (“2018 OPUS Survey Illustrates Interesting Orthopaedic Data,” August 2019, AAOS Now) addressed trends in the U.S. orthopaedic workforce. The next two articles will appear in the October and November issues of AAOS Now.
The Orthopaedic Practice in the United States (OPUS) Survey, also known as the orthopaedic Census Survey, gathers demographics and practice data on U.S. orthopaedic surgeons. It is conducted every two years by the AAOS research, quality, and scientific affairs departments, and the information helps ensure that AAOS members are accurately represented, Academy program and products evolve to reflect changes in membership, and AAOS continues to address the professional needs and interests of its members.
The most recent data from this biennial report come from the 2018 Census Survey, the 17th in the series, which had a response rate of 23.3 percent based on the most recent orthopaedic physician census of 30,141.
This article features changes that have occurred in the orthopaedic workforce over a 10-year period between 2008 and 2018.
Surgeon age
According to data gathered in the 2018 OPUS Survey, the average age of a U.S. orthopaedic surgeon is 56.5 years. Although the average age has been continually increasing since 2008, it appears to be leveling off (Fig. 1). One explanation for the increase is that many orthopaedic surgeons may have postponed retirement for economic reasons as a result of the Great Recession from 2007 to 2009. The 2018 data suggest that entry and exit of orthopaedic surgeons in the workforce have stabilized, resulting in no significant difference in average age of orthopaedic surgeons between the 2016 and 2018 surveys.
Most full-time orthopaedists are between 40 and 59 years old, whereas most part-time orthopaedists are 60 years or older (Fig. 2). These data suggest that many orthopaedic surgeons transition from full- to part-time status prior to retiring. We may see more orthopaedic surgeons transitioning to part-time status earlier in their careers as they pursue work-life balance and as new delivery models become available that better accommodate a part-time workforce (e.g., hospital employment, dual clinical and administrative positions, telemedicine, locum-type employment models, etc.).
Surgeon sex
For years, more than 90 percent of the orthopaedic workforce has been male (Fig. 3). The percentage of females has steadily increased, which is a promising trend toward diversity. The 2018 OPUS Survey shows an increase in the percentage of females among younger orthopaedic surgeon groups (Fig. 4). The trend may take years to fully develop, as the training “pipeline” takes years. If a first-year female medical student decides to pursue a career in orthopaedic surgery, it could take up to 10 years before she enters the orthopaedic surgery workforce (four years for medical school, five years for residency, and one year for fellowship).
Race/ethnicity
Fig. 1 Average age of orthopaedic surgeons

Fig. 2 Age groups for full-time and part-time orthopaedic surgeons

Fig. 3 Orthopaedic surgeon sex over time

Fig. 4 Sex by age group

Table 1 Race/ethnicity of orthopaedic surgeons
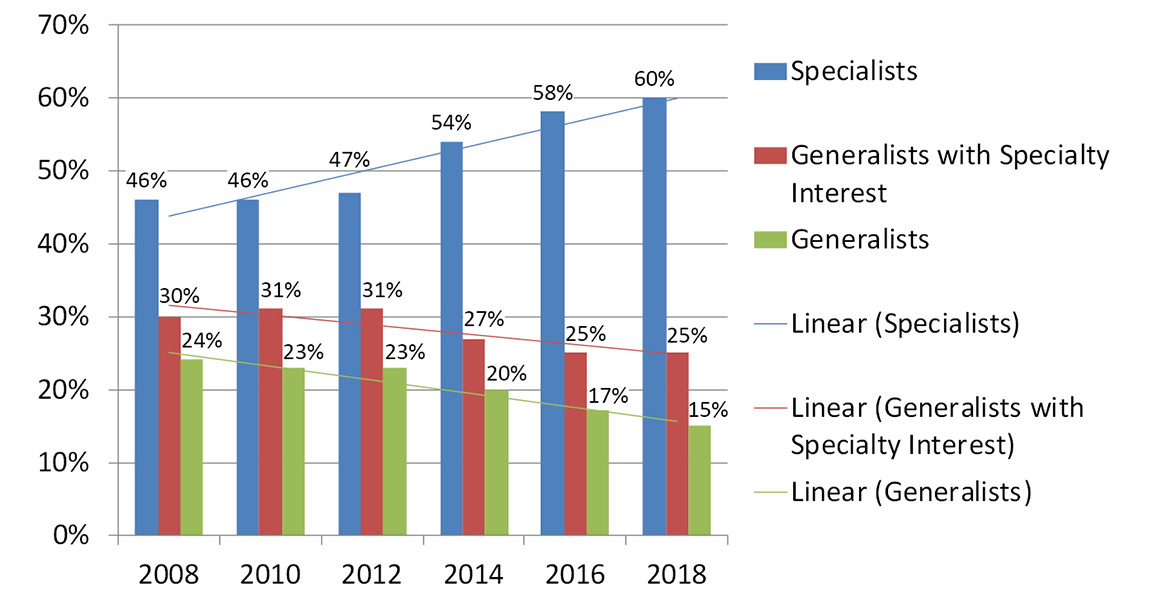
Fig. 5 Degree of specialization over time

Fig. 6 Degree of specialization by age group

Fig. 7 Practice size over time
For years, most of the orthopaedic workforce has been Caucasian. The percentage of Caucasian orthopaedic surgeons has gradually decreased over the past 10 years. Among minorities, Asian Americans lead the racial makeup of both male and female orthopaedic surgeons, followed by Hispanics and African-Americans (Table 1). Orthopaedic surgeon recruitment in the next few years will likely focus on African-American and Hispanic/Latino populations to ensure diversity within the field.
Degree of specialization
According to results of the 2018 OPUS Survey, most (60 percent) U.S. orthopaedists are specialists. Twenty-five percent define themselves as generalists with a specialty interest; only 15 percent report that they are generalists. A comparison
of current OPUS data with reports from 2008 revealed an increase in the percentage of orthopaedists who define themselves as specialists and a decrease in the percentage of orthopaedists who define themselves as generalists (Fig. 5). This trend is consistent with the growing number of orthopaedic residents who pursue fellowship training. An assessment of the degree of specialization by age in 2018 showed that younger orthopaedists tend to be specialists, whereas older orthopaedists tend to be generalists (Fig. 6).
Areas of focus
The AAOS Census Survey asked orthopaedists to identify both their primary specialty and other specialty areas. Since 2008, the top areas of focus have become sports medicine, total joint replacement, and hand surgery. It is unclear whether current subspecialization trends will meet the demands of the communities orthopaedists serve. Although sports medicine continues to remain popular, reconstructive joint replacement is an area of significant demand. In addition, contemporary clinical practice guidelines are questioning the efficacy and value of many arthroscopic procedures for degenerative conditions in older patients. Furthermore, it is possible that, in the future, there will not be enough sports medicine-related pathology to support future sports medicine subspecialists.
Surgeon density
From 2008 to 2016, Wyoming had the highest density of orthopaedic surgeons (most surgeons per 100,000 people), followed closely by Montana. In 2018, Montana had the highest density of orthopaedic surgeons. From 2010 to 2016, Alabama had the lowest density (fewest surgeons per 100,000 people), followed by Mississippi. In 2018, Mississippi had the lowest density. Overall, the density of orthopaedic surgeons is greater in the northern United States that the southern United States. The northwest and northeast continue to maintain high density of orthopaedic surgeons.
Practice size
There has been a steady change in the number of physicians in orthopaedic practices over the past 10 years. In addition, orthopaedic practice size has gotten larger over the past 10 years (Fig. 7). In 2006, nearly one in four orthopaedic surgeons was in solo private practice. Today, only 12 percent of orthopaedic surgeons are in solo private practice. This consolidation is consistent with other segments of the healthcare economy, including hospitals, health systems, payers, industry (medical device and pharmaceutical), group purchasing organizations, etc. Provider consolidation often is driven by economies of scale, increasing buyer and supplier power, a need to better manage government compliance requirements and costs, the ability to coordinate care, and a desire to reduce competition.
The full 2018 OPUS report is available to AAOS members at www.aaos.org/aaoscensus. AAOS members must log in to read the report. It is also available for purchase by AAOS nonmembers.
John Cherf, MD, MPH, MBA, is the practice and payment section leader of the Health Care Systems Committee, a member of the Council on Education, and a member of the AAOS Now Editorial Board.